The Disley Project
Located in the heart of Saskatchewan’s potash production region adjacent some of the most prolific potash solution mines globally.
Located in the World’s Best Jurisdiction for Potash Production

Since mining began in 1962, companies operating in the Elk Point Basin have produced more than 605 million tonnes of potash (KCl), underscoring the basin’s global and geopolitical importance to fertilizer supply and food security.
Source: Cocker, M.D., Orris, G.J., Dunlap, P., Yang, C., and Bliss, J.D., 2023, Geology and undiscovered resource assessment of the potash-bearing, Middle Devonian (Givetian), Prairie Evaporite, Elk Point Basin, Canada and United States: U.S. Geological Survey Scientific Investigations Report 2010–5090–CC, 145 p.
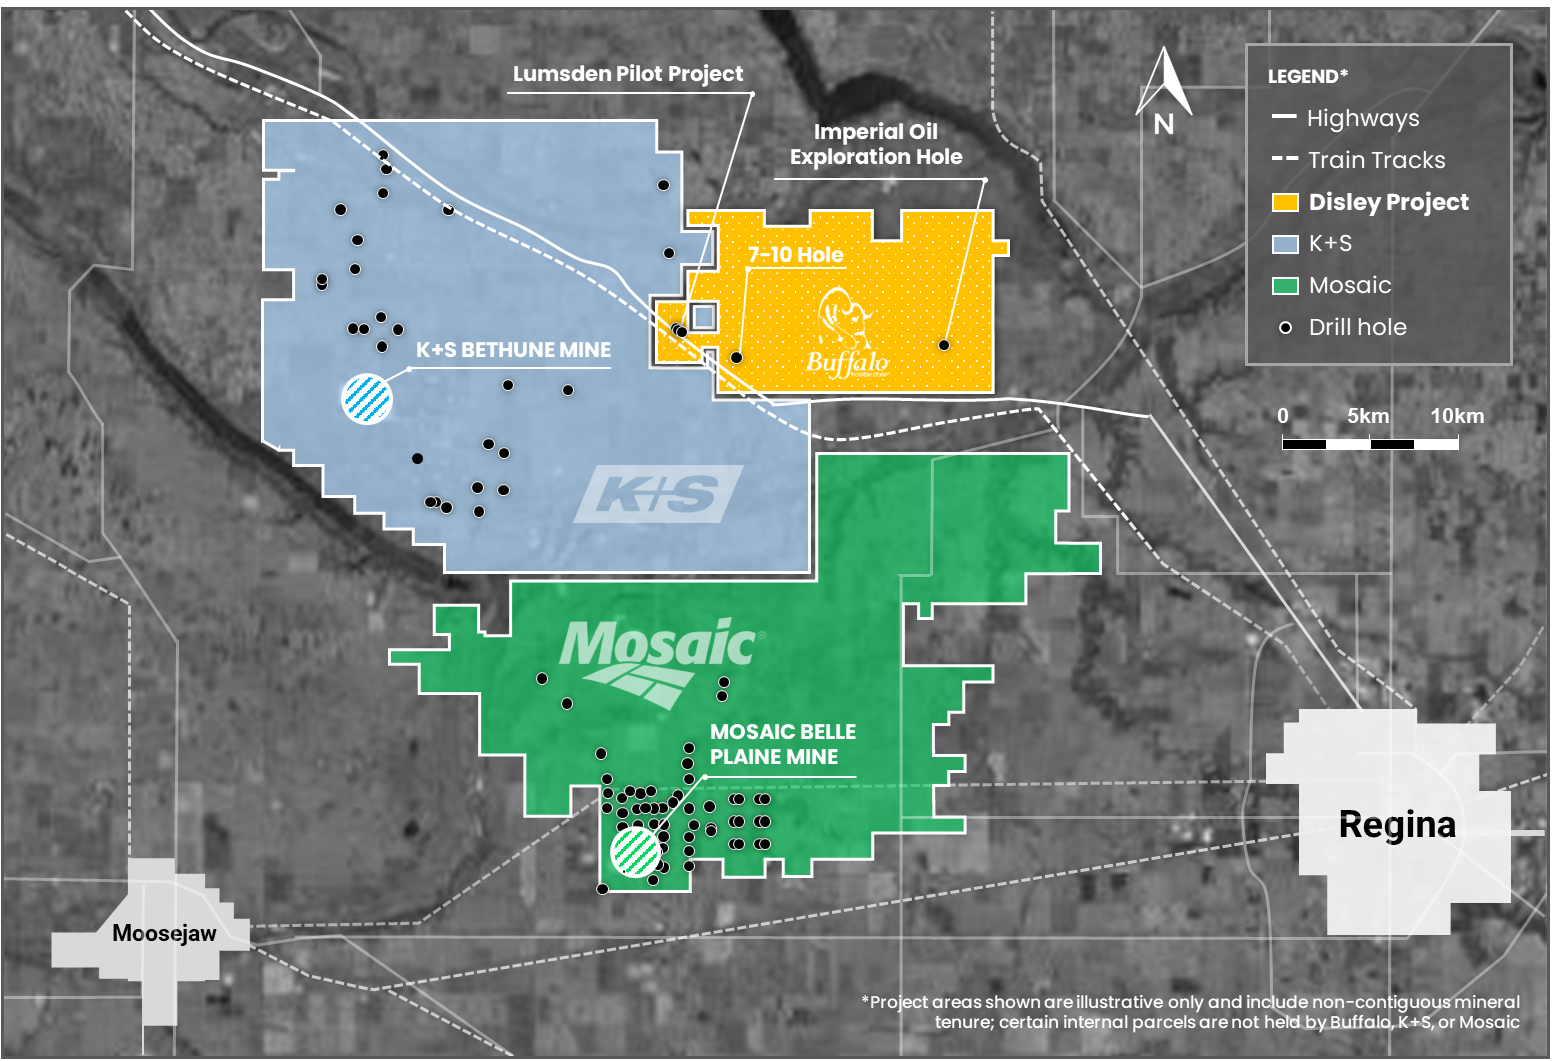
The Disley Project is located in southern Saskatchewan, approximately 50km northwest of Regina and covers approximately 10,610 hectares.
The Disley Project is located approximately 50km northwest of Regina and covers 10,610 hectares. The property is situated immediately adjacent to the east of the K+S Bethune potash solution mine and north of the Mosaic Belle Plaine potash solution mine(1) – both of which are amongst the largest producing potash solution mines in the world. In the opinion of management, the Disley Project is in one of the most favorable areas of Saskatchewan for potash solution mining (see map) as evidenced by the success of these neighboring projects(1).
During the 1960s, two drilling programs were undertaken on the western and eastern portions of the Disley Project.
Legacy potash core samples from these drilling campaigns are now being re-assayed by Buffalo.
- The Lumsden Pilot Project – On the west side of the property, the Lumsden Potash Development Company evaluated the potential for solution mining using brine injection and recovery wells.
- Imperial Oil Exploration Hole – On the east side of the property, Imperial Oil undertook potash-related exploration drilling as part of a regional potash exploration campaign.
(1) The K+S Bethune potash solution mine and north of the Mosaic Belle Plaine potash solution mine (together, the “Adjacent Properties”) may each be considered an “adjacent property” (within the meaning of NI 43-101) to the Company’s Disley Project. The Company does not have any interest in either of the Adjacent Properties. The Company believes this context is useful in illustrating the proven endowment of the district, while noting that mineralization on adjacent or nearby properties is not indicative of mineralization on the Company’s Disley Project. There is no guarantee that the Disley Project will yield comparable results to any of these mines.
Buffalo’s Disley Project is not only exceptional due to its location within Saskatchewan’s established potash solution mining district, in close proximity to some of the largest operating potash solution mines in the world, but also because of the historic technical work completed on the property to date.
Preliminary Economic Assessment (PEA) for Disley Project with After-Tax NPV(1) of US$1.1B and IRR(1) of 30%; Releases Results from Maiden 43-101 Mineral Resource Estimate
PEA Summary
The PEA is preliminary in nature and includes inferred mineral resources, which are considered too speculative geologically to have the economic considerations applied to them that would enable them to be categorized as mineral reserves. There is no certainty that the PEA will be realized.
| Line Item | Units | Total Project |
|---|---|---|
| Production Rate MOP | TPA | 1,000,000 |
| Production Rate Soluble Grade | TPA | 125,000 |
| Total Initial CAPEX | US$ million | 639 |
| CAPEX per Tonne Capacity | US$/tonne | 568 |
| Average Unit OPEX | US$/tonne | 55 |
| MOP Price (25-year avg.) | US$/tonne | 393.61 |
| Soluble Grade Price (25-year avg.) | US$/tonne | 373.62 |
| Pre-Tax NPV(1) (8%) | US$ million | 1,534.67 |
| Pre-Tax IRR(1) | % | 35 |
| Post-Tax NPV(1) (8%) | US$ million | 1,085.47 |
| Post-Tax IRR(1) | % | 30 |
| Steady-State Annual Revenue | US$ million | 442.5 |
| Steady-State Annual EBITDA | US$ million | 251.0 |
Mineral Resource Estimate
Notes:
- The effective date of this MRE is April 15, 2026.
- Dr. Ryan Langdon, Ph.D, CGeol, of Micon is the QP responsible for this MRE.
- The MRE has been classified in the Measured, Indicated and Inferred categories.
- An average specific gravity (SG) value of 2.08 g/cm3 was used.
- Conversion between KCl and K2O was made using the formula KCl = K2O * 1.583
- The MRE used economic assumptions for HLD mining. A deduction was made to account for the presence of mining anomalies not detected by existing drill holes and seismic lines. The values used are 5% for Measured, 9% for Indicated and 25% for Inferred.
- The block model supporting the resource is orthogonal and has a block size of 50 m x 50 m x 0.9 m.
- The mineral resources described above have been prepared in accordance with the current Canadian Institute of Mining, Metallurgy and Petroleum Standards and Practices.
- Numbers have been rounded to the nearest million tonnes. Differences may occur in totals due to rounding.
- Mineral Resources are not Mineral Reserves as they do not have demonstrated economic viability. The quantity and grade of reported Inferred Mineral Resources are uncertain in nature and there has been insufficient exploration; however, it is reasonably expected that a significant portion of Inferred Mineral Resources could be upgraded into Indicated Mineral Resources with further exploration.
- Micon’s QP has not identified any legal, political, environmental, or other factors that could materially affect the potential development of the mineral resource estimate.
| Category | Tonnage (Mt) | Avg KCl Grade | Avg K2O Grade | KCl (Mt) | K2O (Mt) |
|---|---|---|---|---|---|
| Measured | 399.7 | 34.82% | 22.00% | 139.2 | 87.9 |
| Indicated | 1,267.4 | 34.84% | 22.01% | 441.5 | 278.9 |
| Inferred | 2,663.2 | 34.96% | 22.08% | 930.9 | 588.1 |
Capital Expenditure (CAPEX) Summary
The initial capital cost estimate has been prepared in line with the Class 4 definition outlined by AACE International standards, with a contingency of 25% applied to the IPM, Disley East, and Disley West components.
Mechanical equipment represents the largest component of initial capital expenditure at approximately 38% of Total Project initial CAPEX. For Disley East and Disley West, the mechanical scope encompasses the full processing train required to produce export-grade granular MOP, including crystallization, debrining and drying, compaction and glazing, soluble product screening, and product storage and loading. For the IPM, the mechanical scope includes a crystallizer, pumps, tanks, pipework, centrifuge, dryer, and baghouse. Total initial capital expenditure across all three facilities is US$639 million, as summarized in the table below.
| Description | IPM (US$ million) | Disley East (US$ million) | Disley West
(US$ million) | Total Project
(US$ million) |
|---|---|---|---|---|
| Site Works | 0.7 | 11.3 | 11.3 | 23.3 |
| Concrete | – | 5.6 | 5.6 | 11.2 |
| Structural Steel | 1.2 | 9.3 | 9.3 | 19.9 |
| Mechanical | 15.1 | 113.3 | 113.3 | 241.7 |
| Piping | 0.2 | 14.9 | 14.9 | 30.0 |
| Electrical | – | 15.0 | 15.0 | 29.9 |
| Instrumentation | 0.1 | 2.9 | 2.9 | 5.9 |
| Architecture | 0.0 | 19.6 | 19.6 | 39.2 |
| Minor Mechanical | 4.7 | 2.4 | 2.4 | 9.4 |
| General Construction | 1.4 | 13.3 | 13.3 | 28.0 |
| Indirects | – | 36.1 | 36.1 | 72.3 |
| Contingency | 5.8 | 60.9 | 60.9 | 127.7 |
| Total Capital Expenditure† | 29.2 | 304.7 | 304.7 | 638.6 |
Operating Expenses (OPEX) Summary
Buffalo Potash’s estimated operating cost of US$55/t MOP reflects the structural advantages of operating in Saskatchewan, a mature potash jurisdiction with competitive industrial energy rates, an established skilled workforce, and existing road and rail infrastructure adjacent to the Disley Property enabling low-cost delivery to both domestic and export markets. Buffalo management anticipates these fundamentals position the Disley Project to be among the lowest-cost potash producers upon reaching full production.
| Item | Description | 1,125,000 TPA (US$ million) |
|---|---|---|
| IPM Contingency | $14.49/t applied to IPM production only | 1.8 |
| Wellfield Power | 500 Hp at $0.063/kWh | 1.8 |
| Processing Power | 19,356 Hp at $0.063/kWh | 18.0 |
| Drilling | $25,000/day; 45 days/yr | 0.1 |
| Pipes, Pumps, Valves | Steaming & general maintenance | 0.8 |
| Instrumentation | Monitoring & controls | 0.4 |
| Labour | 32 staff | 7.8 |
| Natural Gas | $386/1000m³ incl. carbon tax | 19.6 |
| Maintenance | 5% of major equipment capital | 5.4 |
| Reagents | Dedust oil & anticake amines | 2.0 |
| Water | $2.20/m³; 45 m³/hr | 1.3 |
| General & Admin Supervision | Management & safety | 1.9 |
| Admin Supplies | Office & admin supplies | 0.8 |
| Total Annual OPEX | 61.7 | |
| OPEX US$/t MOP | 55 / tonne |
Summary of Inputs for Economic Analysis
The Disley East and Disley West mines have a start date of construction later than that of the Initial Production Module, and their IRR(1), NPV(1) and Payback periods are all calculated from that later date, while the overall Project results reflect the start date of the IPM. The individual IPM phase has a payback period of 1.1 years, while Disley East and Disley West each respectively have payback periods of 2.9 years. The total Project payback of 4.7 years reflects an earlier calculated start date at the time of first production at the IPM, prior to first production from Disley East and Disley West.
| Input Parameters | Unit | Value |
|---|---|---|
| Evaluation Base Date – IPM | Date | 2026-07-01 |
| Evaluation Base Date – Disley East & Disley West | Date | 2027-07-01 |
| Sales: HLD Mine MOP Sales (granular) | TPA | 1,000,000 |
| Sales: IPM MOP (soluble) | TPA | 125,000 |
| Sales: KCl Brine | m3/yr | 50,000 |
| Price: Granular MOP (FOB Vancouver) 25-year average | US$/t | 394 |
| Price: Soluble MOP 25-year average | US$/t | 374 |
| Price: KCl Brine Brine | US$/m3 | 43 |
| Transport Costs: Granular MOP | US$/t | 43 |
| Transport Costs: Soluble MOP | US$/t | 10 |
| Transport Costs: KCl Brine | US$/m3 | 10 |
| Corporate Tax (Sask. + Canada) | % | 27% |
| Contingency for CAPEX | % | 25% |
| Discount Rate | % | 8% |
| NPV calculation | Years | 25 |
Summary of Outputs
| Metric | Unit | Total Project |
|---|---|---|
| Initial CAPEX | US$ million | 639 |
| OPEX | US$ | 55 / tonne |
| Pre-Tax NPV(1) (8) | US$ million | 1,534 |
| Pre-Tax IRR(1) | % | 35% |
| Post-Tax NPV(1) (8) | US$ million | 1,085 |
| Post-Tax IRR(1) | % | 30% |